Comp Shop, Automated: Store-Level Pricing Data from Home Depot and Lowe's
Every brand that sells through Home Depot or Lowe's runs some version of a comp shop. Someone on the team checks competitor prices, notes what is on promo, and reports back before the next line review.
The problem is how it usually gets done.
The manual comp shop problem
A field rep walks a store with their phone. Or an analyst spot-checks twenty SKUs on homedepot.com from their desk. Either way, three things are true:
It is a sample, not a picture. Twenty SKUs at three stores is not the category. Your competitor may hold price in Atlanta and cut it in Phoenix, and a spot check will never see it.
It is stale by the review. Prices move weekly. A comp shop from three weeks ago describes a shelf that no longer exists.
It does not scale to the hard products. Anything without a clean UPC match, like lumber, millwork, or store-branded pack sizes, gets skipped because matching it by hand is miserable.
What automated store-level data looks like
We run this as a weekly program. One national building products brand has used it at The Home Depot for more than five years, and their national accounts, field, and analyst teams all work from the same file.
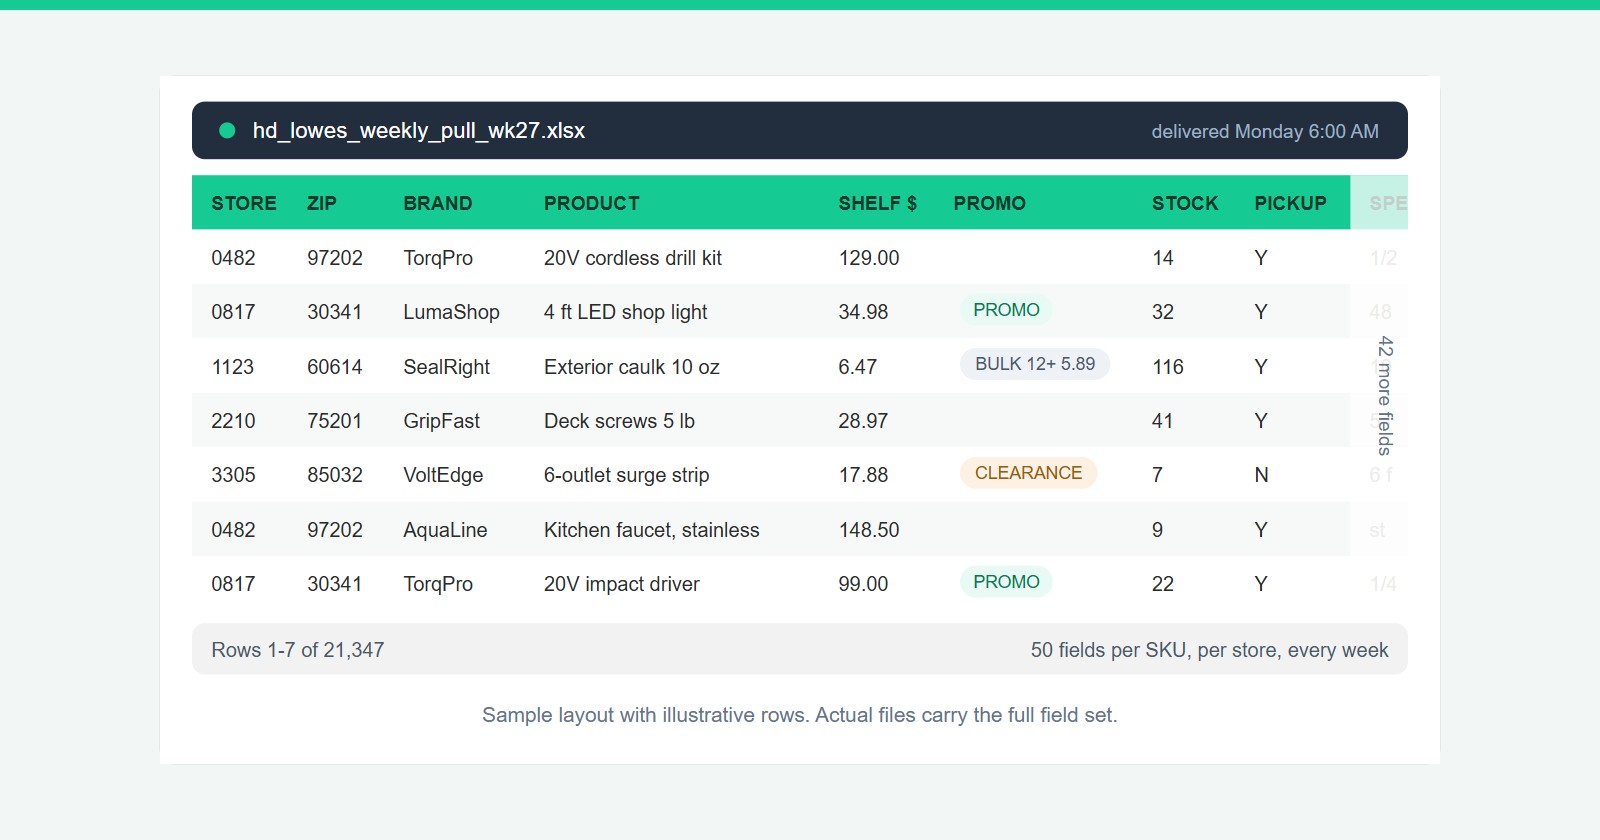
A single weekly pull covers every SKU in the category, priced store by store across the brand's regional footprint. That is typically 20,000+ rows with 50 fields per SKU:
- Shelf price and bulk-break pricing per store
- Promo flags, the week they appear
- In-store stock quantity and pickup availability
- Full product specs, dimensions, and pack sizes
- Non-UPC commodities matched and tracked, including lumber and millwork
No dashboard you have to remember to log into. A clean tabular file your analysts drop straight into their own models.
Who actually uses it
The interesting thing about store-level data is that one file serves the whole retail account team:
National account managers walk into line reviews with store-level facts about competitor pricing and promo activity instead of anecdotes from a store walk.
Field and district teams get their own regional slice, so every district manager acts on their own stores rather than a national average.
Pricing and category analysts get the full feed for price-band tracking, share models, and category reviews.
Where to go from here
We built a page that lays out the full program, including what is in the data and how delivery works: Retail Shelf Intelligence.
If you would rather just see it, ask us for a scrubbed sample of the weekly file, or grab time for a demo. Tell us your category and store footprint and we will take it from there.